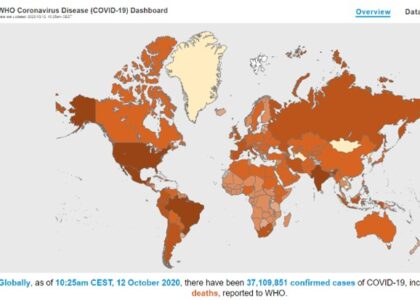
The fundamental analytical act in statistical reasoning is to answer the question “Compared to what?”. A comparison of small multiples is an information perception that simply compares many different data in a format of charts, grids and many more. Whether one is evaluating changes over space or time, plotting out variables, the essential point is to make intelligent and appropriate comparisons. As for further elaboration on how Tufte’s principle of information design can be used to represent data from a large event, this post will look into graphical data published by WHO (World Health Organization) in relation to COVID-19 number of cases and deaths. WHO (World Health Organization) looked at the demographic impact that the new Coronavirus had in different parts of the world since the wild spread in February 2020. However, to digitally represent these statistics to the world they have used Tufte’s comparison of multiples to differentiate each element as well as make it more understandable to the readers. As for further elaboration, the below Fig-1 and Fig-2 are the perfect examples of how these comparisons should be represented on a large scale.

Fig-1 – Choropleth map of cases with yellow colour indicating zero cases and dark blue being the most affected areas.

Fig-2 – Choropleth map of deaths with yellow colour indicating zero cases and dark orange being the most affected areas.
The data represented on both figures above are consistently narrowed to its most accurate number. The report allows individuals to compare, analyse, and keep up to date with the latest figures on COVID-19 (WHO, 2020).
(Tufte, 1983) the representation of numbers as physically measured on the surface of the graphic itself should be directly proportional to the numerical quantities represented. Clear, detailed, and thorough labelling should be used to avoid graphical distortion and ambiguity. Show data variation, not design variation because information can vary widely even for related data.
WHO has also stretched to create a “bubble map” representing the same data but with different graphical detail. For example, instead of colouring each country they used blue coloured circles to pinpoint the exact part of the country that has been affected while the world map is all in white.

Fig-3 – Bubble map of cases with yellow circles indicating zero cases and dark blue being the most affected areas.

Fig-4 – Bubble map of deaths with yellow circles indicating zero deaths and dark orange being the most affected areas.
The comparison of two elements can certainly be misunderstood in this case by the readers as WHO designers opted to white out the certain parts of the world map on Fig-3 and Fig-4 by giving people a sense of “safe areas”. However, they have implemented all rules as their comparison reflects some logical order geographically and time which also shares the same measures, scales, size, and shape.
References:
Study.com. 2020. Edward Tufte: 6 Principles Of Graphical Integrity. [online] Available at: <https://study.com/academy/lesson/edward-tufte-6-principles-of-graphical-integrity.html> [Accessed 5 November 2020].
Medium. 2020. Getting Started With ‘Small Multiples’ – An Underused But Powerful Form Of Data Viz. [online] Available at: <https://medium.com/nightingale/getting-started-with-small-multiples-an-underused-but-powerful-form-of-data-viz-3e0a8f8139dc> [Accessed 3 November 2020].
Tufte, E., 1983. The Visual Display Of Quantitative Information. 2nd ed. Graphics Press USA, pp.50-120.


