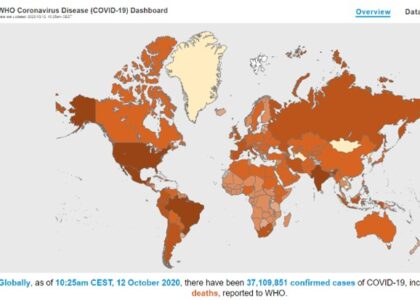
The narrative over a specific time and a specific space can be otherwise defined as analysing data or materials from one specific period of time to another. Meaning, the data gathered should be compared from when to when including where which is considered Tufte as “space”. As a further elaboration to simplify this point, there will be further examples using WHO (World Health Organization) data on COVID-19 from its early stages on February 2020 up to November 11th 2020.
As seen in Fig-1 below, WHO has been presenting to its readers a weekly update on COVID-19 from February 1st, 2020 to November 11th, 2020, and the Fig-1 below shows the comparison between confirmed cases and the number of deaths over the above mentioned specific time and specific place which in this case the entire world. The below graphical representation of such may appear to be a simple concept to put together but in reality, is much more complex than it seems due to the amount of data involved. However, using Tufte’s narrative over space and time theory, everything is much simpler as his theory meant to combine all repeated data which occurs over time in one particular space.
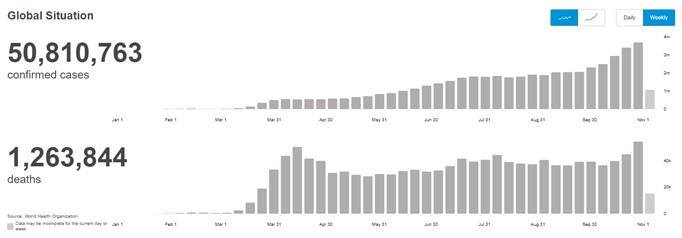
Fig-1 – COVID-19 current global situation from February 2020 to November 11th 2020
Tufte’s theory of envisioning information is direct and straightforward. One could use the same theory in different ways and the result would be clear as well simple to the readers. For instance, World Health Organization also used the same theory to present weekly updates for the number of deaths on COVID-19 for the same period of time but as seen below in the Fig-2 they narrowed the specific place to “Region” however the result is still clear to understand in a graphical format with multiple data.
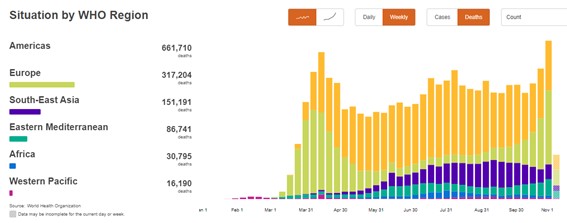
Fig-2 – COVID-19 current number of deaths by region from February 2020 to November 11th 2020
Both Fig-1 and Fig-2 are using the same Tufte’s theory to envision information although design-wise seems to have some differences in terms of colour and little in structure, however, this goes to prove that every representation should have its appropriate structure to draw the readers attention to what is important.
References:
Tufte. E.R., 1983. The Visual Display of Quantitative Information. Cheshire, Connecticut: Graphics Press.
Tufte. E.R., 1990. Envisioning Information. Cheshire, Connecticut: Graphics Press.
Tufte, E.R., 1997. Visual Explanations: Images and Quantities, Evidence and Narrative. Cheshire, Connecticut: Graphics Press.
Tufte, E.R., 2006. Beautiful Evidence. Cheshire, Connecticut: Graphics Press.
Tufte. E.R., 1990. Envisioning Information. Cheshire, Connecticut: Graphics Press. (pp. 81-93). https://www.bbc.co.uk/news/uk-51768274
Zachry, M. and Thralls, C., 2004. An Interview with Edward R. Tufte. Technical Communication Quarterly. [Online], 13(4), pp. 447–462. Available at: https://www.edwardtufte.com/tufte/s15427625tcq1304_5.pdf [Accessed 7 March 2016].